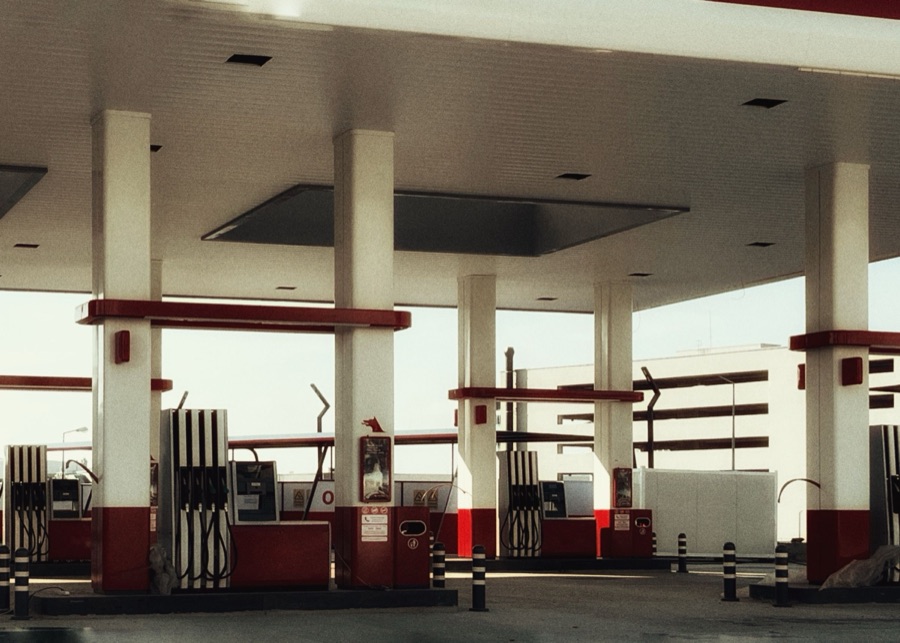
 For Sale
6 Stores
For Sale
6 Stores
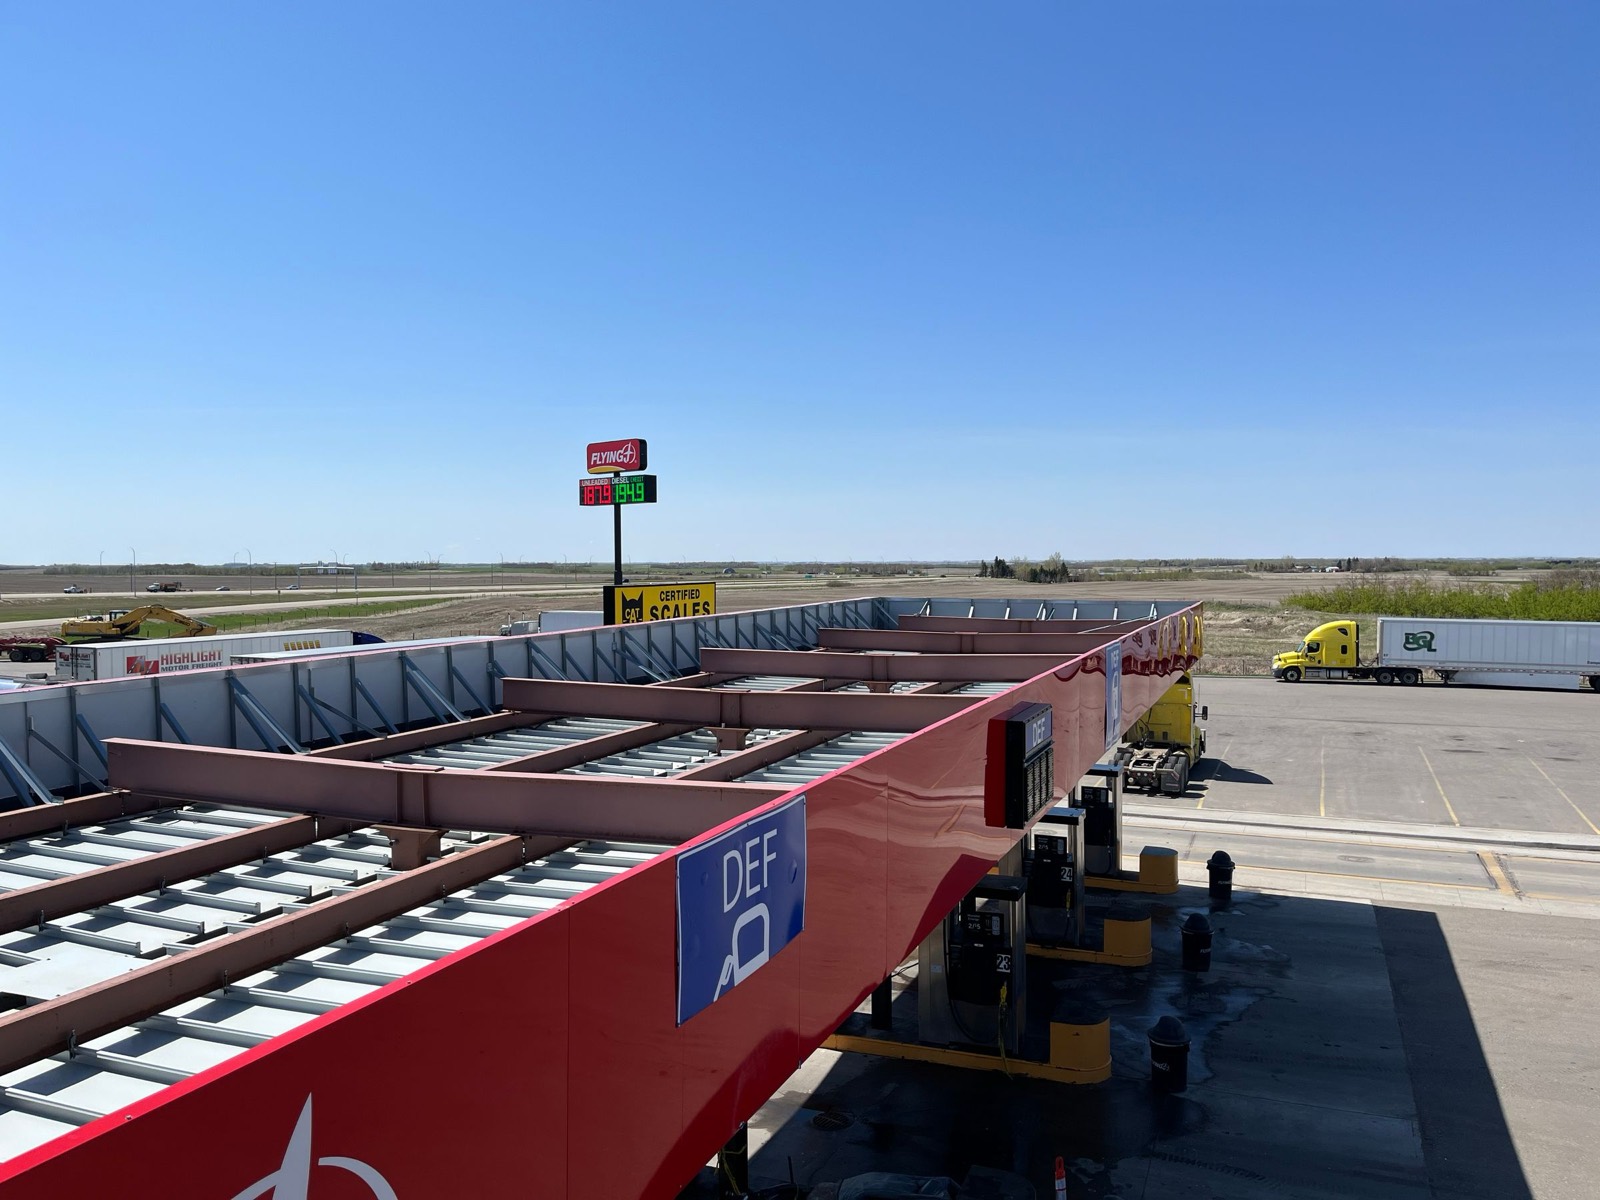
For sale
Gas Station Portfolios for sale.
National brokerage for multi-site fuel and C-store packages: how portfolios price on blended cap rates, how to finance scale, and how to buy or sell a package.
Active deals
Available now
Key takeaways
- Portfolios trade on blended cap rates near the national average of about 5.6% with fuel and 6.87% without, with premium tenants like Wawa pricing as tight as 4.83% and weaker markets at 6.5% or more.
- Real estate plus business packages typically value at about 8x EBITDA, 7x to 9x in premium markets, versus 4.0x to 7.0x EBITDA for combined deals and 2.5x to 4.0x for business-only sites.
- Financing scale is harder than single sites: SBA 7(a) caps at $5M and many conventional banks avoid underground storage tank exposure due to CERCLA, pushing larger portfolios toward portfolio bank debt or conventional terms at 30% to 40% down.
- Each location needs its own Phase I ESA at $1,800 to $3,500 per site under ASTM E1527-21, so environmental diligence and per-site review drive both timeline and price.
- With about 60% of the roughly 152,000 US C-stores still single-store operators, sellers can command a scale premium by aggregating sites into one clean package before going to market.
A gas station portfolio is a package of 2 or more fuel and convenience sites sold together, often under one ownership entity or a shared brand supply agreement. Buyers acquire scale in a single transaction, spread tenant and geographic risk across multiple locations, and gain pricing power with fuel jobbers and inside vendors. Portfolios trade on blended cap rates and aggregate cash flow rather than one site at a time, which changes how you underwrite, finance, and close. With about 152,000 US convenience stores and roughly 60% still single-store operators, consolidation is the defining trend of this market. Gas Station Trader brokers fuel and C-store portfolios nationally and works directly with owners assembling exit-ready packages. This page covers what these assets are, how they price, and how to buy or sell one.
What a gas station portfolio is
A portfolio is 2 or more fuel and convenience sites sold as one transaction. The package can be branded under a single major (7-Eleven, Circle K, Murphy USA) or hold mixed and unbranded sites tied together by a common jobber fuel supply agreement. Some portfolios are pure real estate with tenants in place on net leases. Others bundle operating businesses, inventory, and goodwill alongside the dirt. Many combine both.
The structure matters because it sets your underwriting frame. A net-leased package is priced off rent and credit. An operating package is priced off store-level cash flow across every location. Most US portfolios skew toward smaller independents, since about 60% of the 152,000 US C-stores are single-store operators now consolidating into groups. Review our NNN gas station listings and branded gas station listings to see the range.
Why buyers want portfolios
Scale is the draw. One closing delivers multiple income streams, which spreads tenant default and local market risk across sites instead of betting on a single corner. Group buyers gain real pricing power with fuel suppliers and inside vendors, and they can centralize accounting, loyalty, and management across the package.
The profit engine is the store, not the pump. In 2025 fuel gross margins averaged 40 plus cents per gallon, but net fuel profit is only a few cents per gallon after card fees and freight. Inside items carry 20% to 40% margins, and the C-store is roughly 30% of revenue but about 70% of profit. A portfolio multiplies that inside margin across every location. Owners often net about $70K to $100K per site, ranging to $100K to $500K at stronger locations. See gas station profit margins and is owning a gas station profitable.
How portfolios are valued and priced
Portfolios trade on blended cap rates and aggregate cash flow, not site by site. The national average is about 5.6% with fuel and 6.87% without. Tenant credit moves the number: Wawa prices 4.83% to 5.20%, 7-Eleven 5.00% to 5.40%, Murphy USA near 5.13%, and Circle K 5.35% to 5.65%. Geography matters too, with Florida tightest near 5.11%, Texas about 5.63%, and weaker markets at 6.0% to 6.5% or higher.
On an earnings basis, business-only packages run 2.5x to 4.0x EBITDA, combined deals 4.0x to 7.0x EBITDA, and real estate plus business about 8x EBITDA, reaching 7x to 9x in premium markets. Fuel volume often values at $0.05 to $0.30 per gallon of monthly throughput. Model a package with our cap rate calculator and valuation calculator, and read what is a good cap rate for a gas station.
How to buy a portfolio
Financing scale is the first hurdle. SBA 7(a) caps at $5M per borrower and special-purpose fuel sites require a 15% minimum equity injection, with real estate terms up to 25 years and June 2026 rates around 9% to 11.5% APR variable. Larger packages move to conventional or portfolio bank debt at 30% to 40% down, and many banks avoid underground storage tank exposure due to CERCLA liability. Compare paths in SBA vs conventional and our finance services.
Diligence is per site. Each location needs its own Phase I ESA at $1,800 to $3,500 under ASTM E1527-21, required for SBA fuel deals. Review tank records, fuel contracts, and store-level financials across every site. Work the full due diligence checklist and start with our buyer representation.
How to sell a portfolio
Sellers earn a scale premium by delivering one clean, exit-ready package. Aggregate trailing financials by site, reconcile fuel volumes and inside margins, and resolve open tank and environmental items before going to market. A documented package shortens diligence and supports a tighter blended cap rate.
Cost and timing matter. Business broker commissions run 10% to 20% on business-only deals and about 6% to 10% on real-estate-inclusive transactions, with sale timelines of 3 to 6 months typical. Owners holding the real estate can also weigh a sale-leaseback to monetize the dirt while keeping operations, or a 1031 exchange into NNN replacement property, where you have 45 days to identify and 180 days to close. Plan the exit with our seller services and exit planning guide.
FAQ
Common questions
A portfolio is 2 or more fuel and convenience sites sold together, usually under one ownership entity or a shared fuel supply agreement. Packages can be net-leased real estate, operating businesses, or both, and may be single-branded, mixed, or unbranded. Buyers underwrite the package on blended cap rates and aggregate cash flow rather than evaluating each site in isolation.
They trade on blended cap rates and combined earnings. The national average is about 5.6% with fuel and 6.87% without, varying by tenant credit and geography. On earnings, business-only runs 2.5x to 4.0x EBITDA, combined deals 4.0x to 7.0x, and real estate plus business about 8x, reaching 7x to 9x in premium markets. Fuel volume often values at $0.05 to $0.30 per gallon of monthly throughput.
SBA 7(a) caps at $5M with a 15% minimum equity injection for special-purpose fuel sites and terms up to 25 years, with June 2026 rates around 9% to 11.5% APR variable. Larger portfolios use conventional or portfolio bank debt at 30% to 40% down. Many banks avoid underground storage tank exposure due to CERCLA, so lender selection matters on bigger packages.
Diligence is per location. Each site needs its own Phase I ESA at $1,800 to $3,500 under ASTM E1527-21, required for SBA fuel deals, plus a review of tank records, fuel contracts, and store-level financials. Reconciling fuel volumes and inside margins across every site is what drives both timeline and price. Sale timelines of 3 to 6 months are typical.
Put us to work
Want this asset type in your inbox?
Join deal alerts and we will send matching opportunities, including off-market deals.